This blog covers the session: Uncover the secret life of your APIs with Azure API Management, by Miao Jiang, Senior Program Manager at Microsoft.
Agenda
- How to observe your APIs with API Management
- Azure API Management
- Observability options
- Self-hosted gateway
- Demo
- Conclusion
How to observe your APIs with API Management
Building an API would involve lots of work and time. With all the time and effort, your API may or may not work as expected. If it works as expected, then it is fine, and what if your API does not work as expected. Sometimes you want to know how others are using your API, or you want to know the performance and Latency of your API. You may even want to avoid intentional and unintentional attacks on your APIs. To achieve all of these, we need to increase the observability.
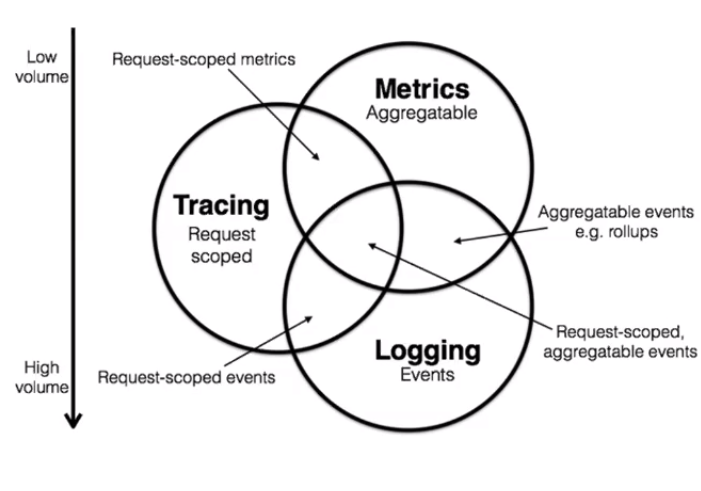
Miao Jiang referred his favorite definition on Observability

Data that a system produces can be a matrix, logging, tracing, or combination of any two or three of these data
APIM can be used to apply observability to all our APIs in a consistent way.
Azure API Management
There are three components in Azure API management
- API Gateway
- Developer Portal
- Management Plan
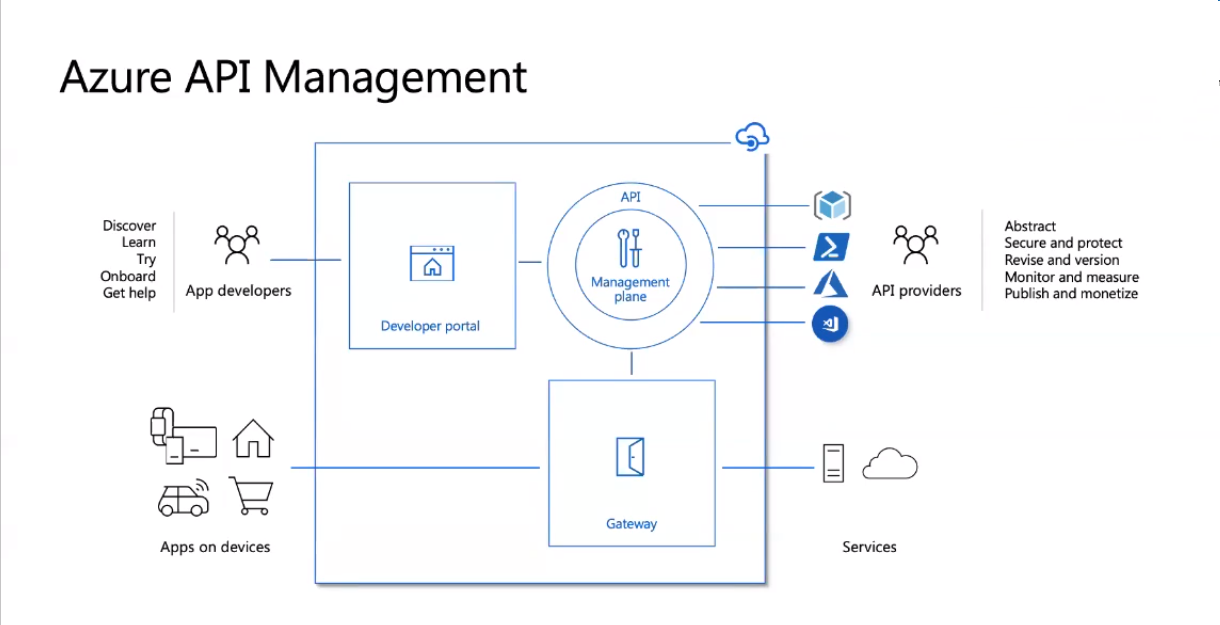
APIM instances can be updated or altered using the Management plan which can be accessed from different tools like VS Code extension, Azure portal, PowerShell, ARM templates.
Observability can be achieved by integrating API with Azure Monitor, Azure application insight, and Azure Event Hubs.
The following are the various observability options provided for Azure API.
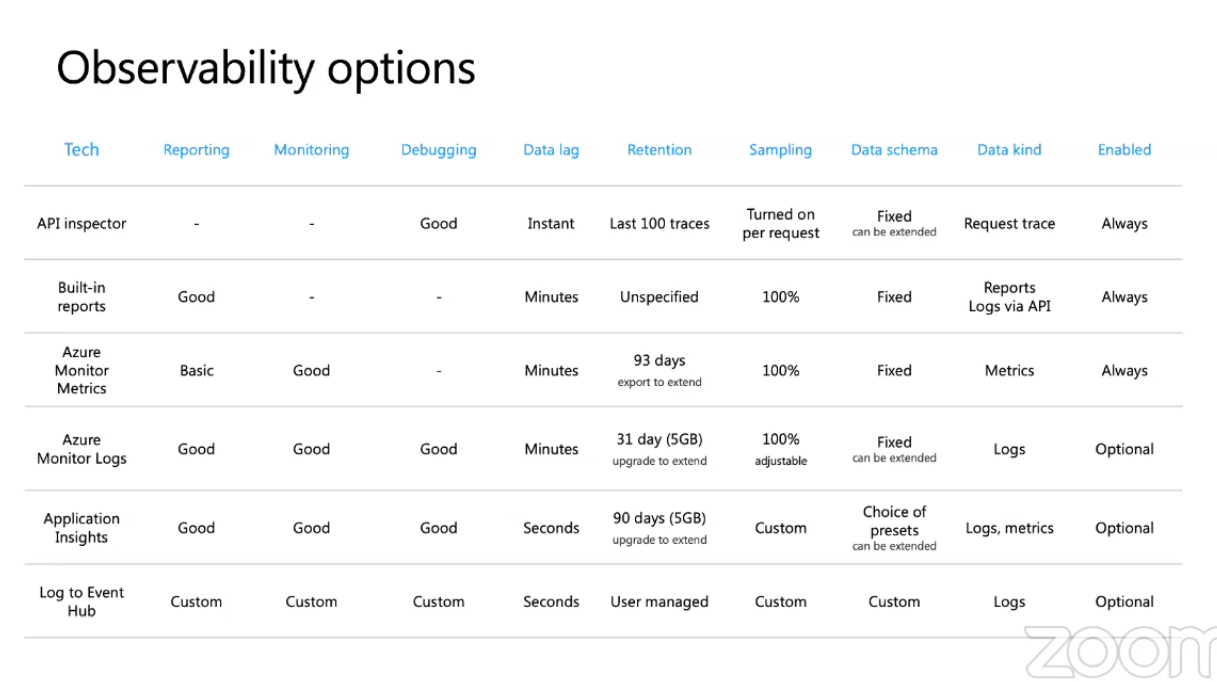
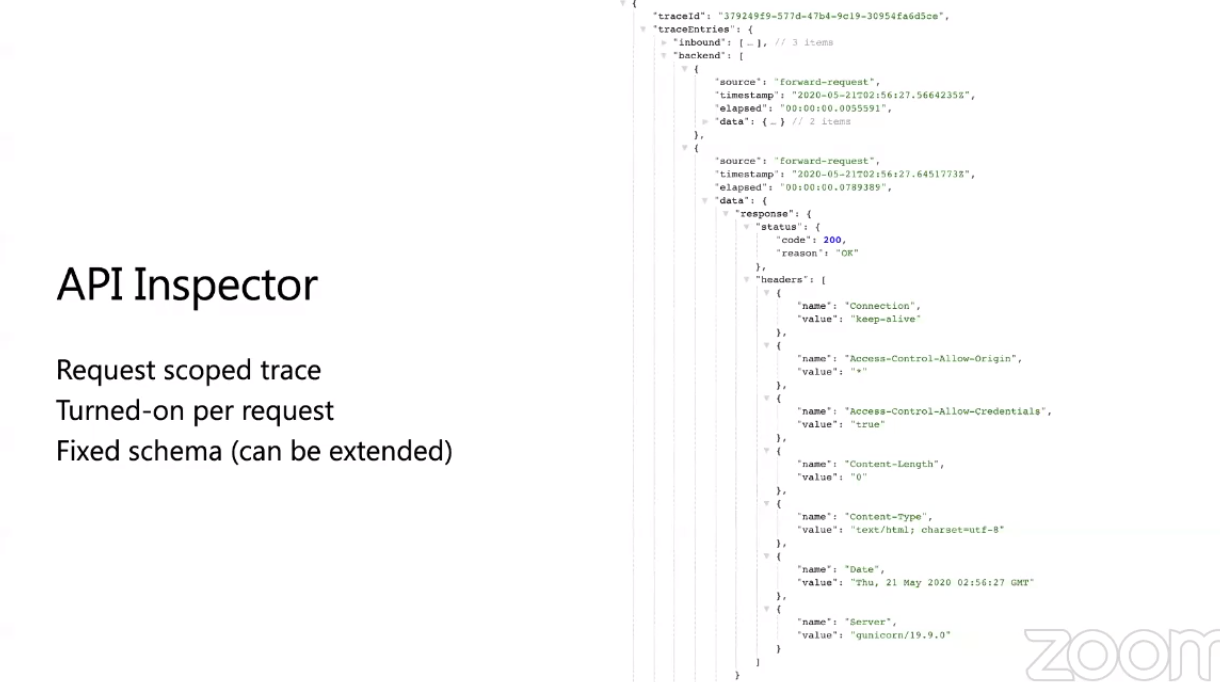
API Inspector
API Inspector allows you to troubleshoot your API in Realtime. This feature can be turned on per request with a special header and this allows you to retrieve information like the Request received by the API, what policies have been applied to these requests, duration of each policy execution, and the request sent by the API to the backend and even also the response received. All the exceptions happening while executing our API can be viewed here.
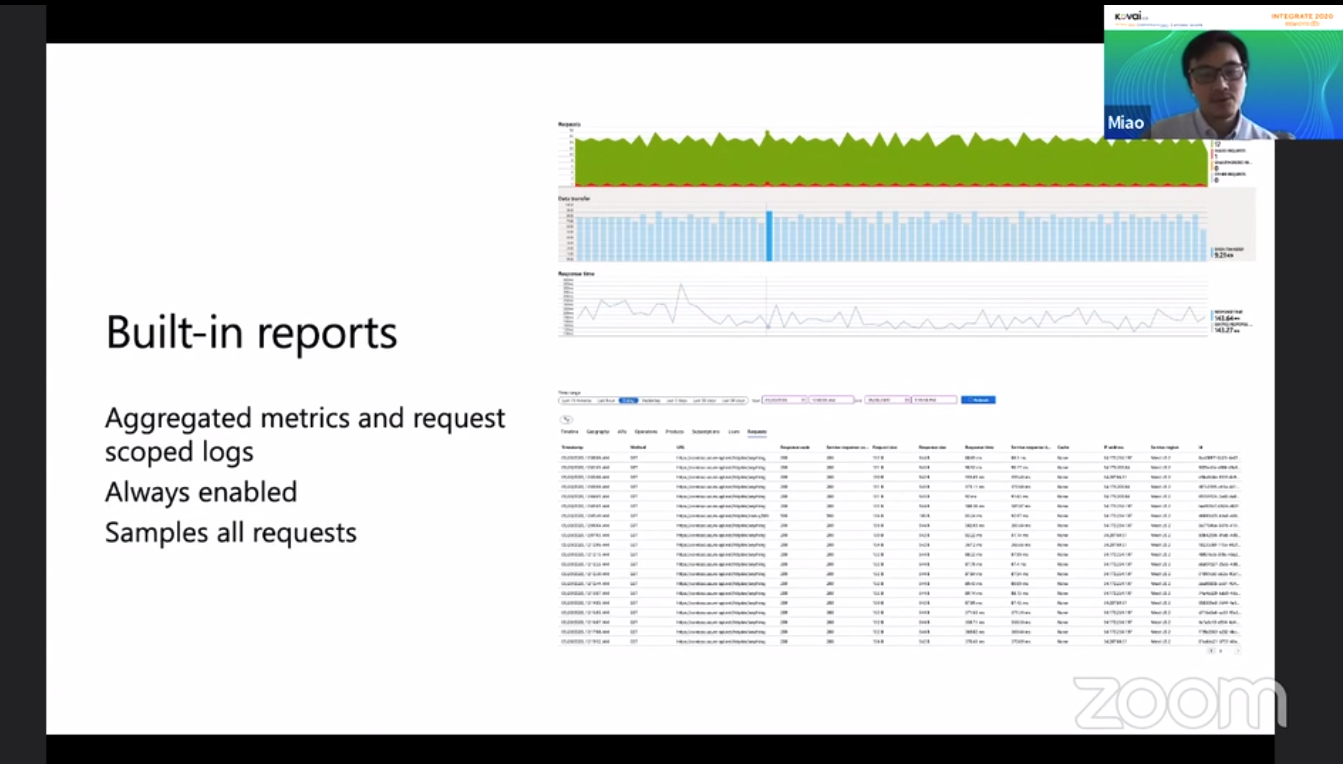
Built-in reports
Built-in reports can be used to get Aggregated metrics and request scopes logs. This feature is always enabled by default. And this feature samples all requests. This can be used to get a quick review of the overall health of your APIs. This is always available in the Azure portal.
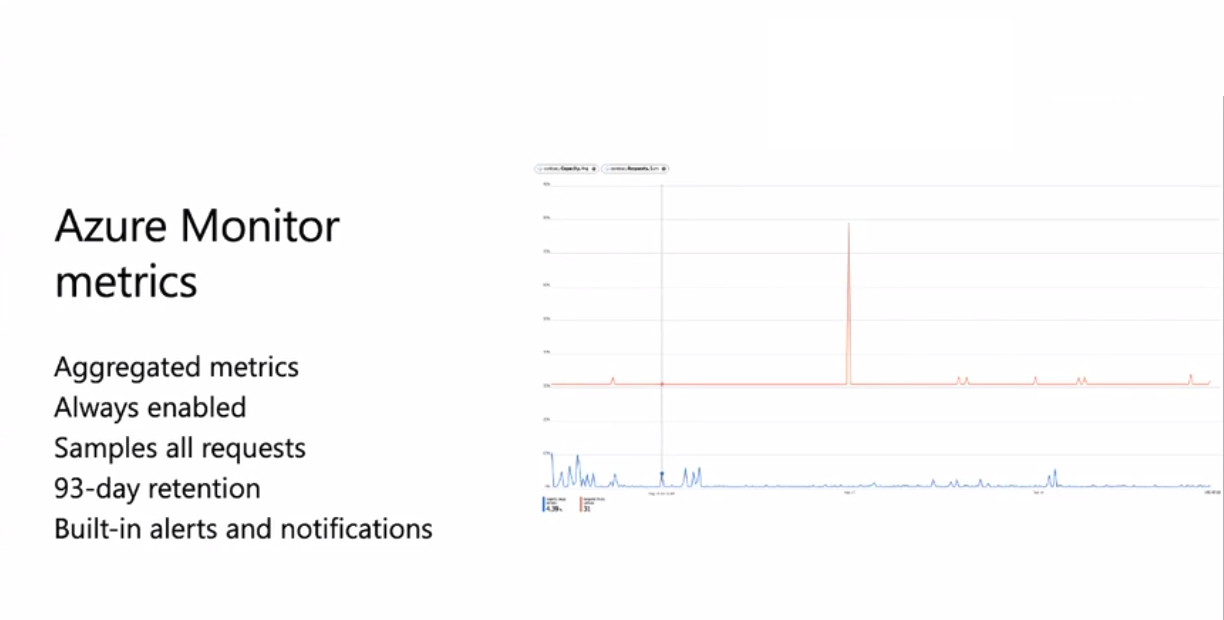
Azure Monitor metrics
Azure Monitor can be used to get Aggregated metrics and these monitors can be used to monitor API Management service and publish them. This feature is always enabled by default. And this feature samples all requests. By default, data retention is about 93-days, and this can also be extended.
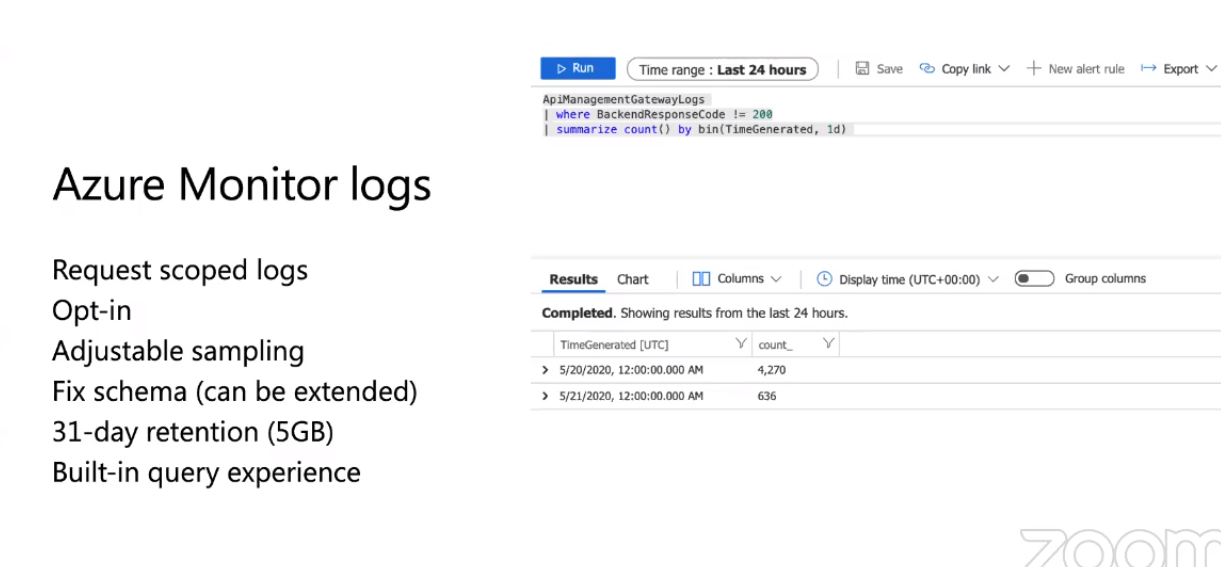
Azure Monitor logs
Information about each individual request like the response code from APIM management, response code from backend, Latency, and exception or error details. This feature is not enabled by default and the user has to opt-in for this feature. Data retention is 31-days.
Self-hosted gateway
This enables the user to deploy the gateway components of Azure API Management anywhere (in other clouds, or on-premise)
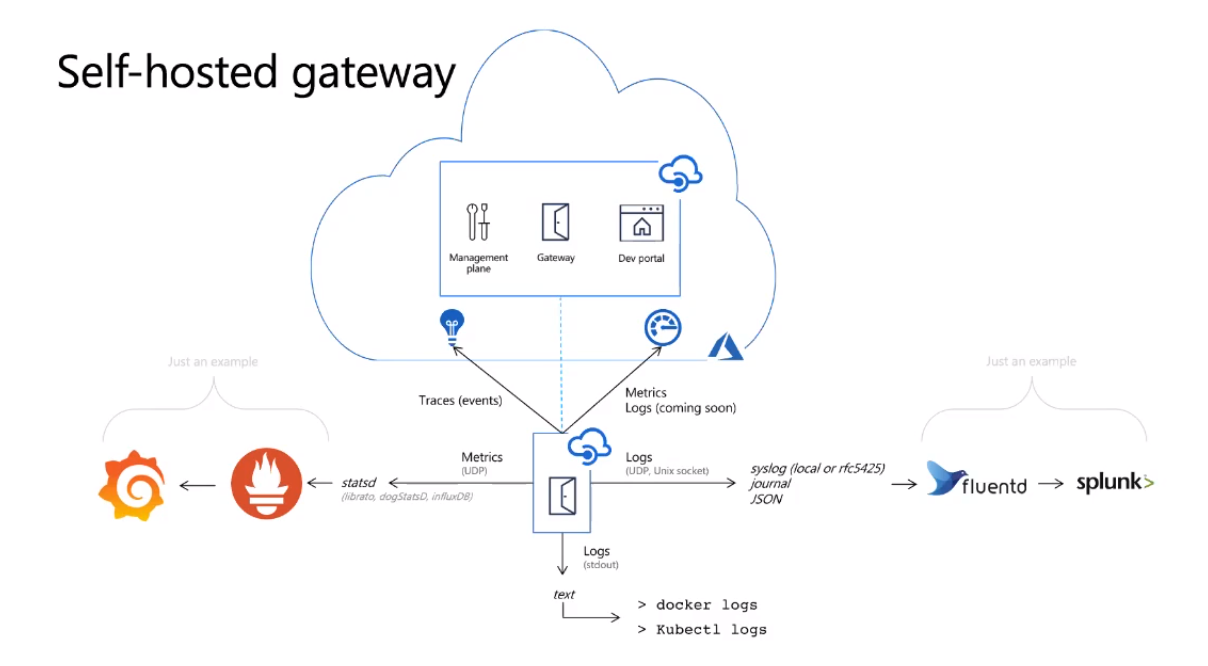
Self-hosted gateway logs in Log Analytics – Metrics are available now
Azure AD credentials –Alternative to SAS tokens
Custom CA root certificates – From linked API Management service
Upstream TLS and cypher configuration – From linked API Management service
Self-hosted gateway on Arc Kubernetes – Use Azure control plane and policies to deploy and keep self-hosted gateways up to date
Self-hosted gateway limitations
- Built-in cache
- Service Fabric integration
- TLS session resumption
- Client certificate renegotiation
- Windows container
- Fully disconnected mode
Demo
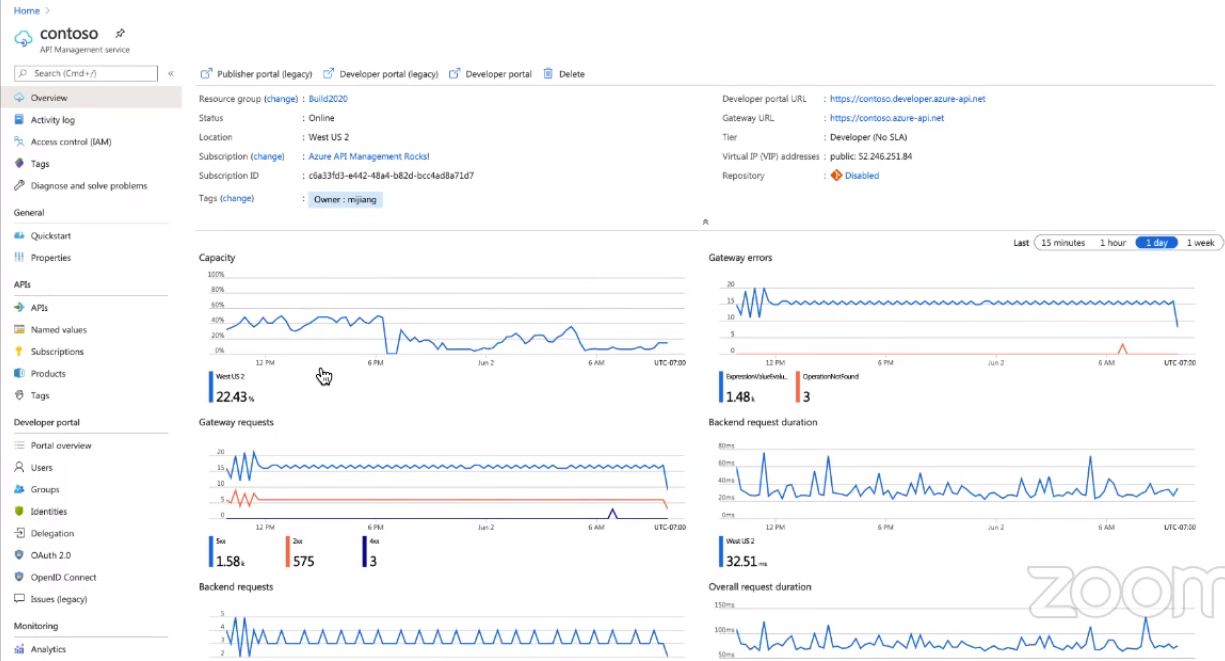
This is an API Management instance created for the demo purpose where already there are some details displayed.
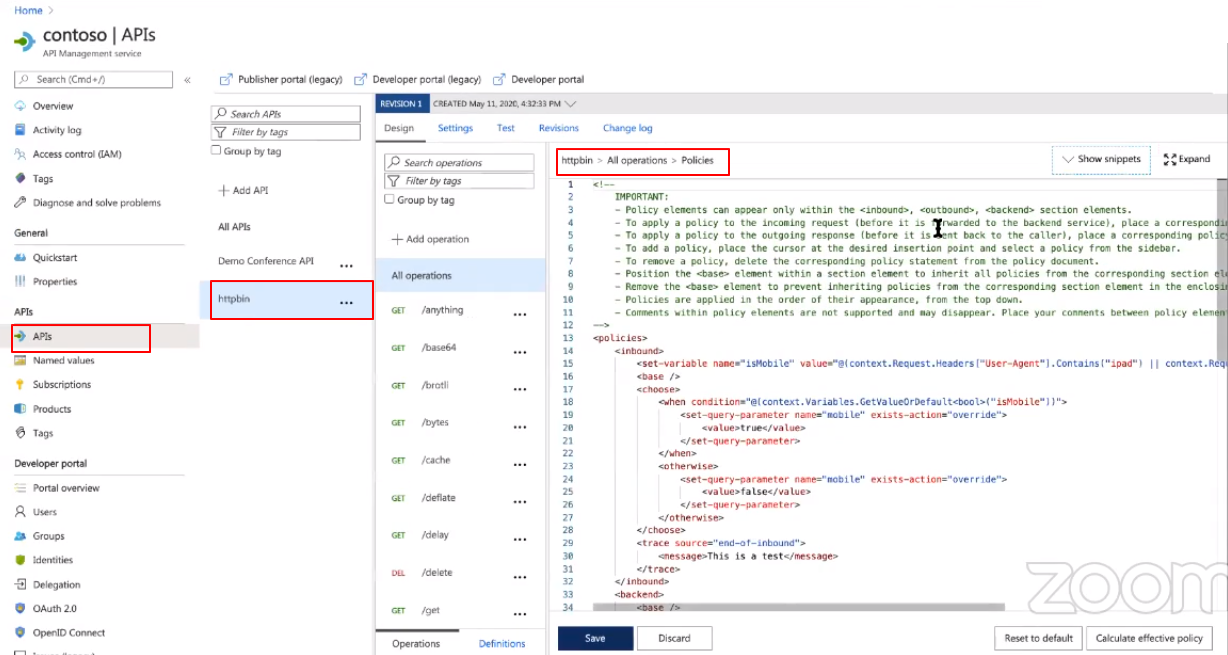
Go to API’s -> HTTPbin ->Policies, where you can find an existing code which can be coded depending on your API. This code can be used to define the policies of your API.
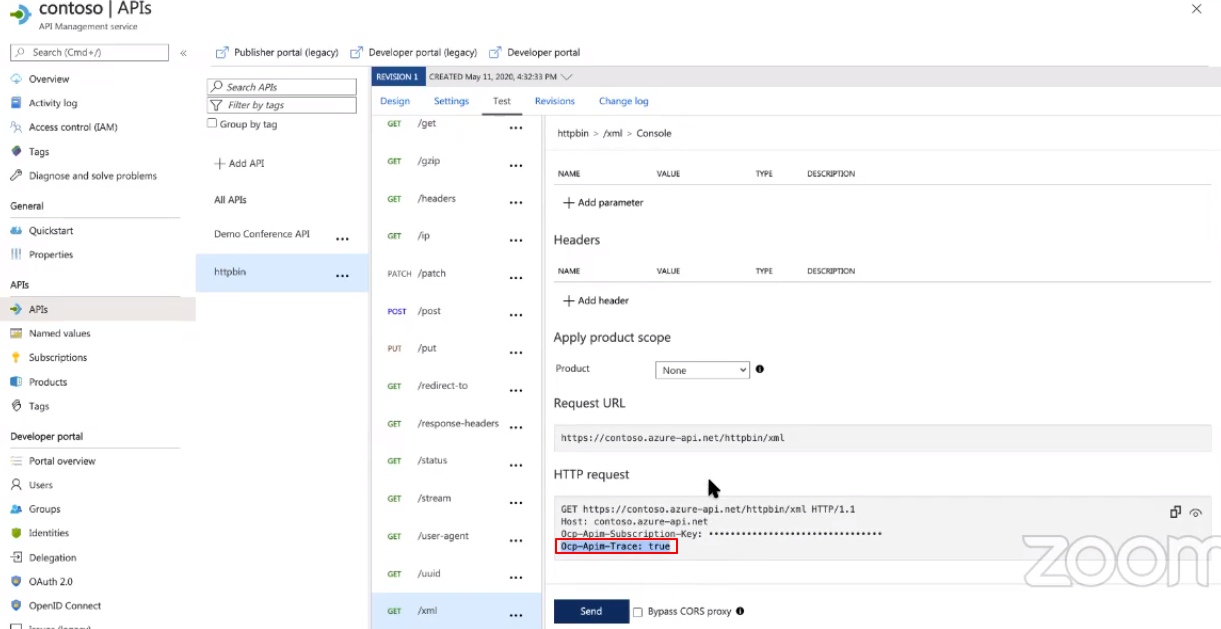
This is the special API header that is needed for accessing the API Inspector.
Consider, you are having multiple azure resources connected and share the information. They could be your Logic Apps, Function Apps, Service Bus, and they could form an application together. Here comes the APIM as a gateway for this whole Application. Systems will access this APIM gateway and share the information for further processing. Here we would need a strong tracking tool to track the whole application and its performance.
We can use Business Activity Monitoring in Turbo360 to track this whole application and perform distributed tracing. We can leverage the exposed BAM API and policies in APIM to track the requests, responses, and server errors of the whole application.
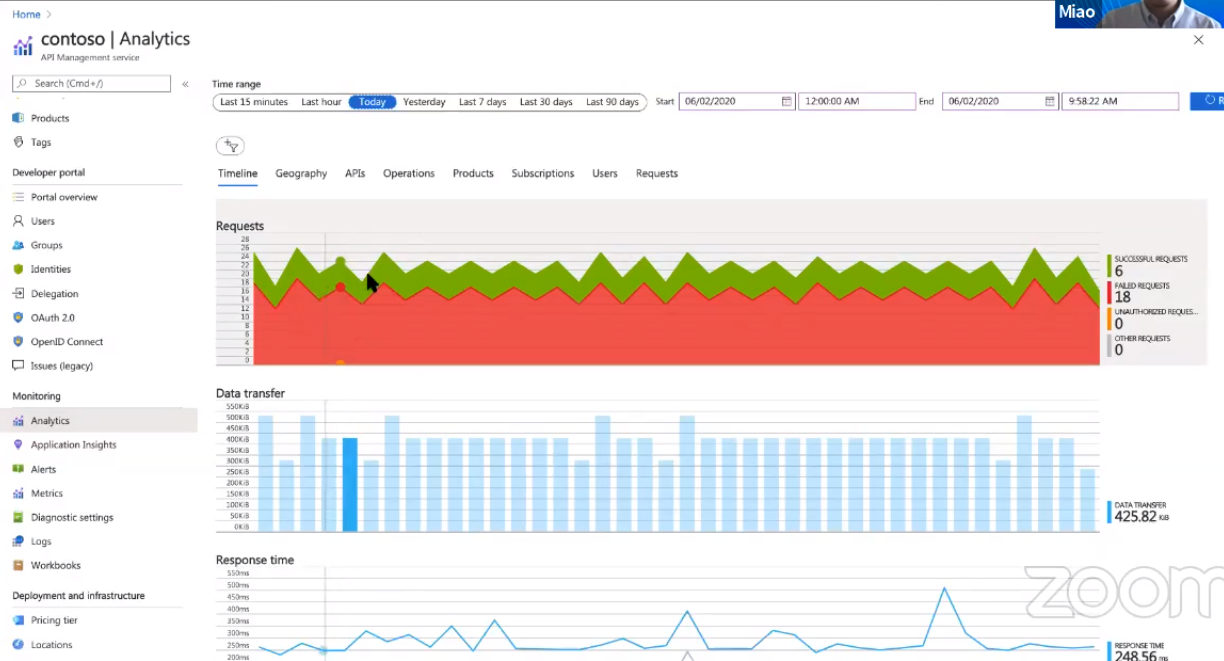
By clicking on the analytics, we have an API Inspector which is created by default showing the total request, data transfer, response time.
Click on the Geography to see where your API is hosted
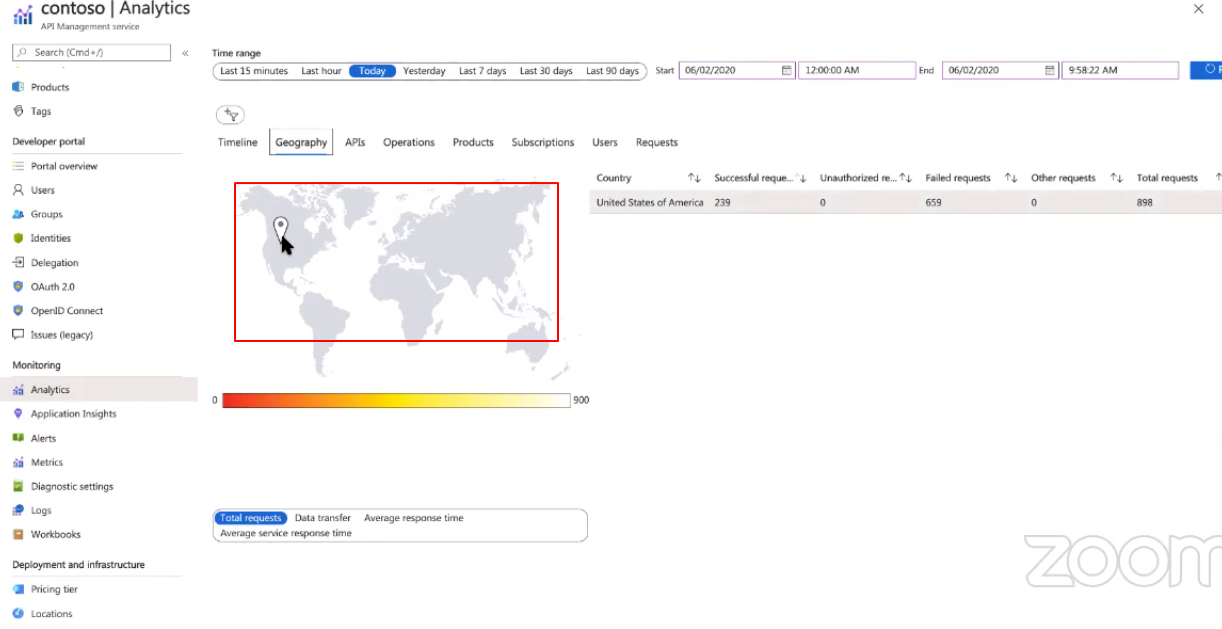
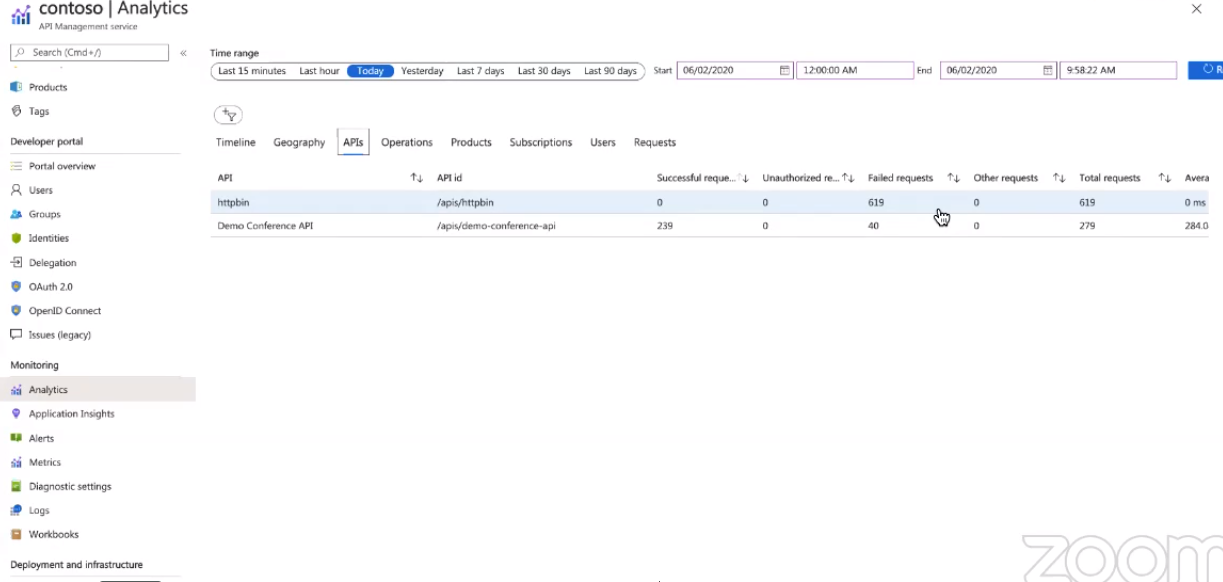
Where in the APIs you can view the total number of failed requests, Unauthorized requests, other details of your API requests.
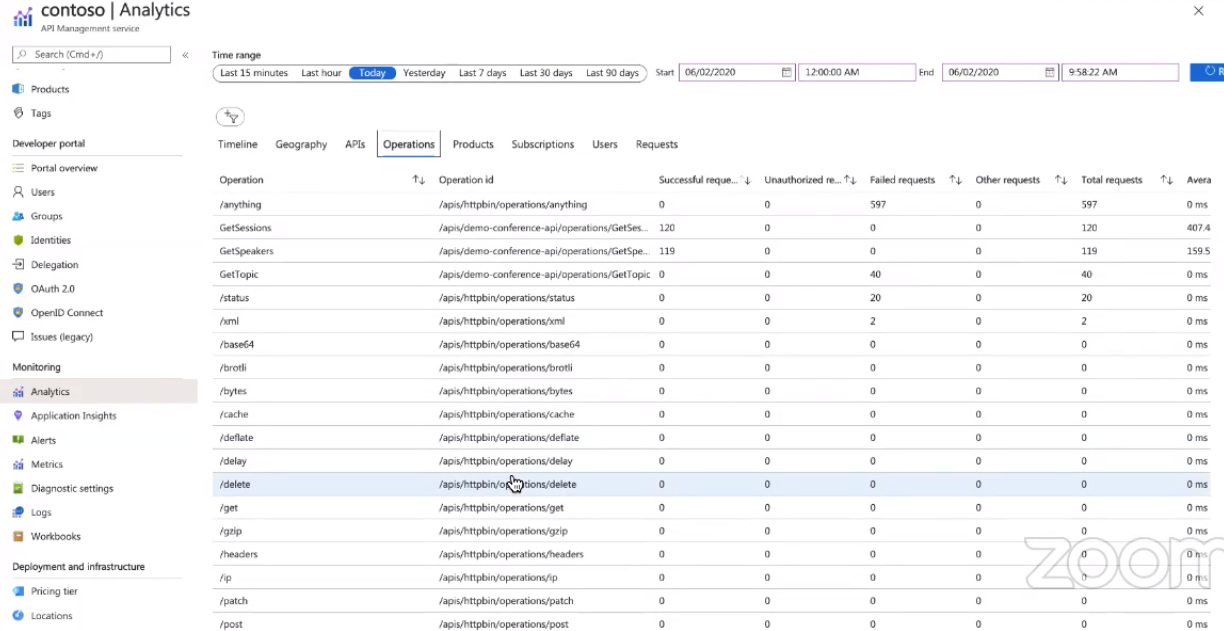
The same can be viewed in the Operations tab
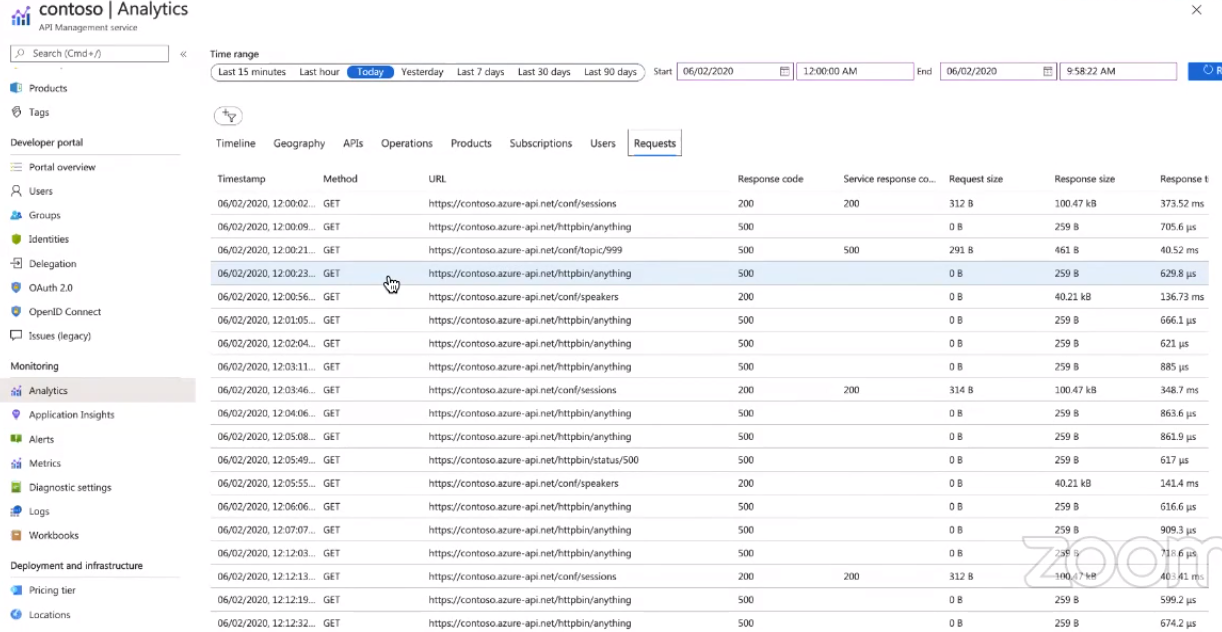
In the Request section, you can view each individual request in our API from where we can obtain the Response code, request size, response time.
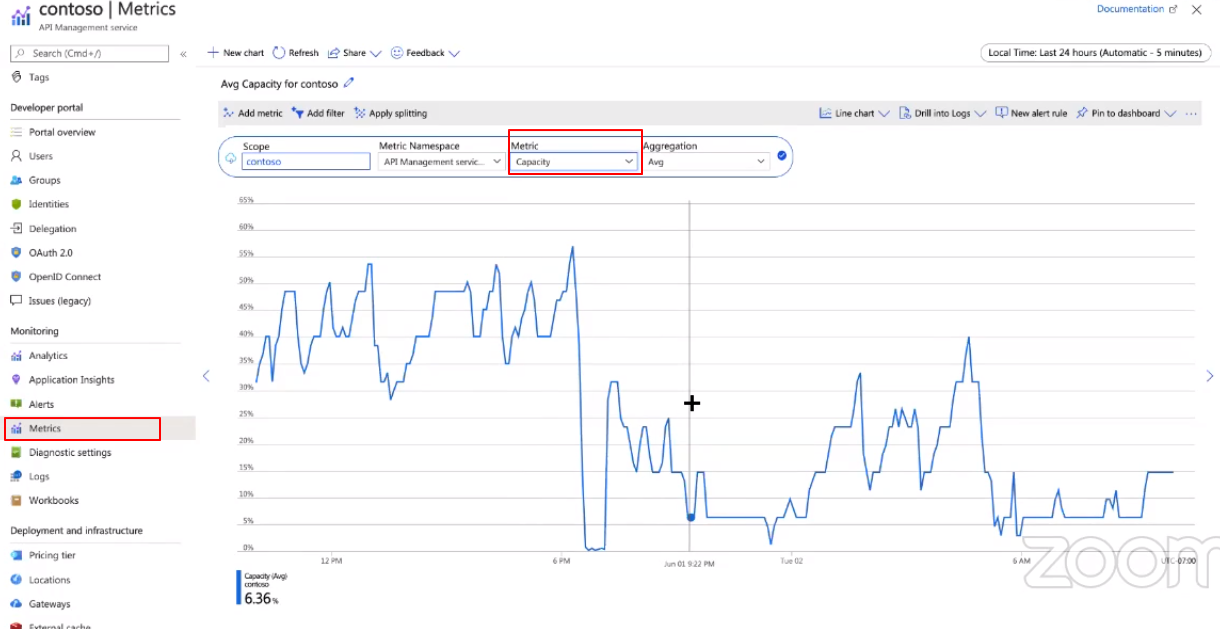
Move to the Metrics tab where you can select the metric we want. This feature is available by default.
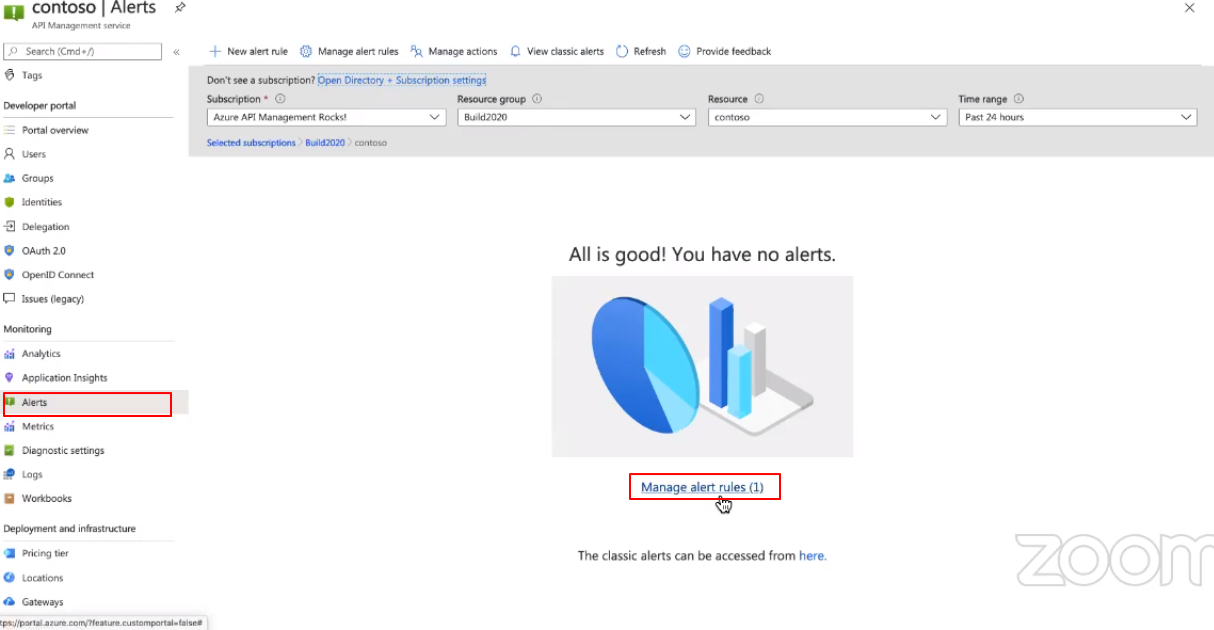
Move to the Alerts view, configure alerts, and get notified on the status of API. If alert rules are already created, then you can also manage them. In the alerts view, we can configure alerts for specific data like request failed, response code, etc, and get notified. Azure Monitor also comes with the auto scalability option where scaling happened based on the instances.
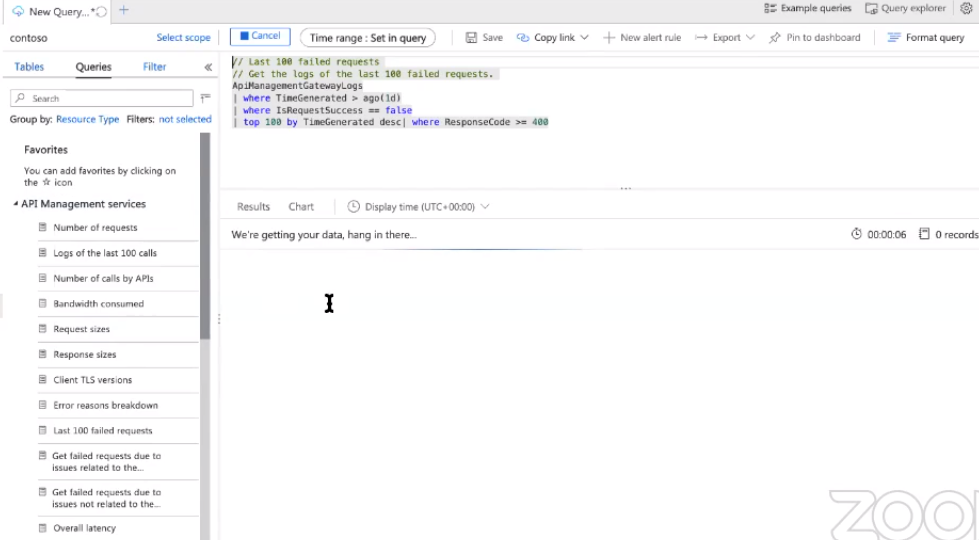
Azure also provides options to Query your request and perform actions on it.
If we want to query the last 100 failed requests below is the code.
Application Map for Azure API
Using the Application map option, we can see how our API is communicating with the backend and other services.
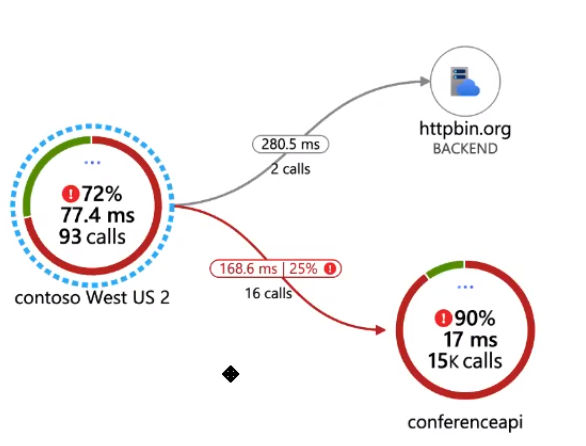
This Application Map gives better visibility on what is happening in APIM. Sometimes, the user would also want to visualize the status of the whole Application behind the APIM. Here comes the Service Map in Turbo360. This gives you the full visibility on Azure Serverless applications on how the resources are connected and where is the actual problem in the whole application and many more
Conclusion
In this blog, we saw how API policies can be added to your APIs and how Azure APIM helps users to manage their APIs effectively. In this session, we also covered how to check whether your API is working as expected or not. If not, how to troubleshoot them.